This AI Hub × DACON competition asked participants to classify customers into segments A–E using credit card data from July through December 2018. I entered solo with three days remaining and worked on it from April 22–24, 2025. The training set contained 2.4 million rows, the test set 600,000, and each had 857 features. Given the feature count and short schedule, I started by inspecting the raw data and establishing a focused EDA process.
EDA criteria
The baseline trained XGBoost without separate preprocessing. I first used feature names to identify duplicate
fields and redundant features representing the same information, such as dates and elapsed durations. I then
examined correlations alongside XGBoost feature importance. Balance-change-rate features such as
변동률_잔액_B1M/B3M/B6M were highly correlated, so I retained only the one-month value for short-term change
and the 12-month value for long-term change.
Feature cleanup alone did not materially improve the F1 score. Further analysis revealed a severe class imbalance: class E had 1,922,052 examples while class B had only 144, and applying class weights produced a clearer gain. I then ran hyperparameter optimization with Optuna and tracked the experiments with Weights & Biases.
Scores—and an experiment I rolled back
The F1 score changed as follows:
| Stage | F1 score |
|---|---|
| Baseline | 0.6094777315 |
| Feature cleanup | 0.6100311547 |
| Class weights | 0.6233150159 |
| Optuna hyperparameter optimization | 0.6807361123 |
Feature cleanup improved the score by only 0.0006; the largest gain came from Optuna optimization. Because the data was divided by month, I also trained a separate model for each month and ensembled them. The single July model scored 0.6526258004, however, while the ensemble fell to 0.5207443808. I could not diagnose the cause within the short competition window, so I stopped pursuing that experiment and returned to the original data.
I finished 9th overall, in the top 4%.
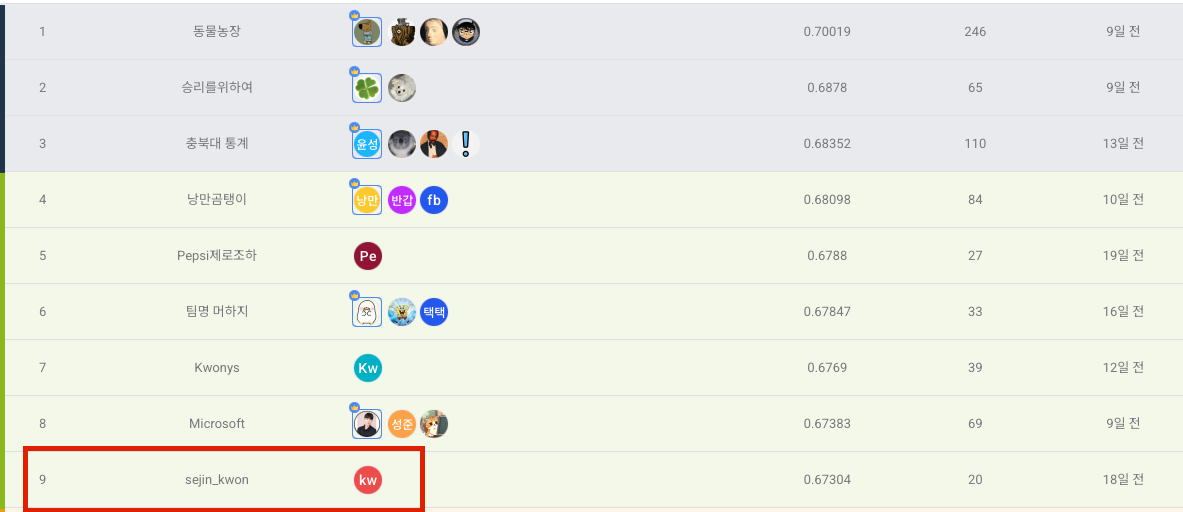
The result is available on the AI Hub public leaderboard.